
India’s combined merchandise and services exports were estimated at $568.84 billion during April–October 2026-27, up 16.66% from $487.59 billion in the corresponding period a year earlier, according to data released by the Ministry of Commerce and Industry on 13 November.
Merchandise exports rose faster, increasing 21.96% to $309.06 billion from $253.40 billion. Non-petroleum merchandise exports reached $259.22 billion, an 18.01% increase from $219.66 billion.
October trade accelerates
Total exports of goods and services in October were estimated at $89.99 billion, 29.90% higher than the $69.27 billion recorded in October 2025. Imports were estimated at $110.07 billion, up 16.58% from $94.42 billion.
The resulting combined trade deficit was about $20.09 billion, narrower than $25.15 billion a year earlier. The services figures for October are estimates because the latest services-trade data released by the Reserve Bank of India cover September.
Merchandise exports for October stood at $49.47 billion, compared with $34.11 billion a year earlier. Merchandise imports increased to $89.35 billion from $76.69 billion. Services exports were estimated at $40.51 billion and services imports at $20.72 billion.
Sector drivers
Petroleum-product exports increased 140.21% year on year in October to $8.89 billion. Electronic-goods exports rose 62.70% to $6.64 billion, while gems and jewellery exports increased 40.06% to $3.21 billion.
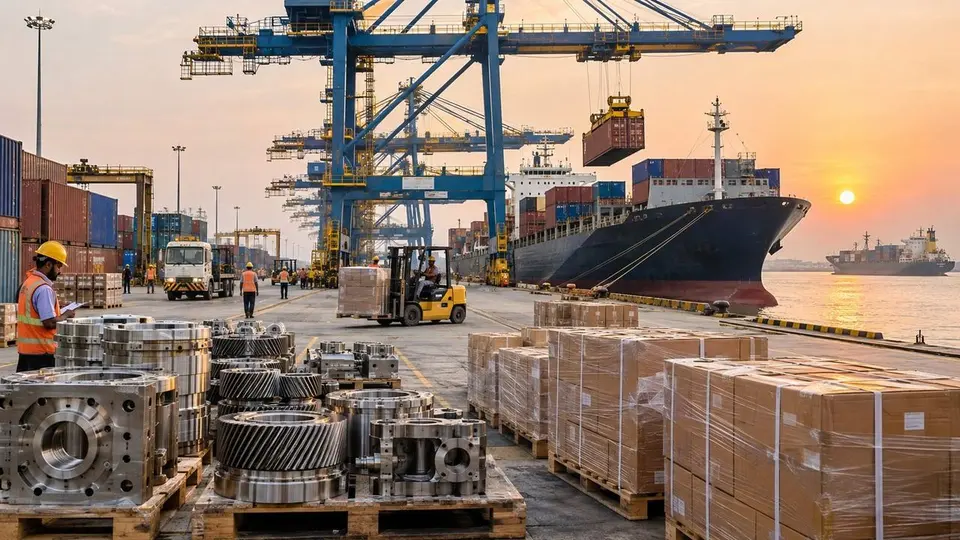
Organic and inorganic chemical exports advanced 36.20% to $2.89 billion. Engineering-goods exports, a broader indicator of industrial competitiveness, climbed 36.01% to $12.74 billion from $9.37 billion.
The composition matters because the headline gain was not confined to one product group. Electronics and engineering goods both recorded substantial expansion alongside petroleum products, while non-petroleum exports remained higher across the seven-month period.
The ministry’s release uses revised pro-rata figures for April–October 2025-26 and April–June 2026-27 based on quarterly balance-of-payments data. That methodological note is important when comparing the latest release with earlier monthly estimates.
For corporate planners, the seven-month measure offers a broader signal than the volatile monthly comparison. Sustained non-petroleum growth can support utilisation at ports, freight operators and export-oriented factories, but the faster October import bill also points to strong demand for energy, components and capital goods. The net effect on individual businesses will vary with their import intensity and invoicing currency.
The services estimate continued to provide a sizeable offset to the goods deficit. Final services figures could change once the RBI publishes the relevant monthly data, so the combined October balance should be treated as provisional rather than a settled external-sector result.
Key numbers
April–October total exports: $568.84 billion April–October merchandise exports: $309.06 billion October total exports: $89.99 billion October total imports: $110.07 billion
What boards and CFOs should note
- Exporters should separate volume growth from price and currency effects when assessing order-book momentum.
- The stronger electronics and engineering numbers may influence capacity, supplier and working-capital decisions.
- Import-dependent businesses should track the still-large merchandise deficit and its implications for currency and funding costs.
Source: Ministry of Commerce and Industry via PIB, 13 November 2026. This is a summary of an official release, published as general information. It is not legal, tax or investment advice.
This article is journalism and commentary. It is not a recommendation to buy or sell any security, and it is not professional advice. Read the full disclaimer.